|
12/8/2015 0 Comments Track your traffic
Since I worked at The New York Times R&D Lab I have grown an obsession with the visualization to map internet traffic. It is very intriguing to see how the traffic is moving from one page to another or what people in a geographic area is consuming. A simple example of that is given by Nik Hanselman here.
Thus, I have been developing a similar visualization with the data that we get. Challenges to address here are -
Latter problem is handled easily by new HTML5 format through SSE. I relaxed the former requirement and took data for past 1 minute altogether and flashing the points after every one second in order of their arrival.
The video shows what I have so far. This is my ongoing project and I keep on changing it. Few changes that I am thinking of are :
1. Show the map in Isometric view and let the points translate linearly out from the flat surface. 2. Build it as a generic platform that can build dashboard like system and filter out the traffic based on factors and attributes. Static version of traffic analysis can be found here: https://public.tableau.com/views/traffic_analysis_0/Sheet1?:embed=y&:display_count=yes&:showTabs=y 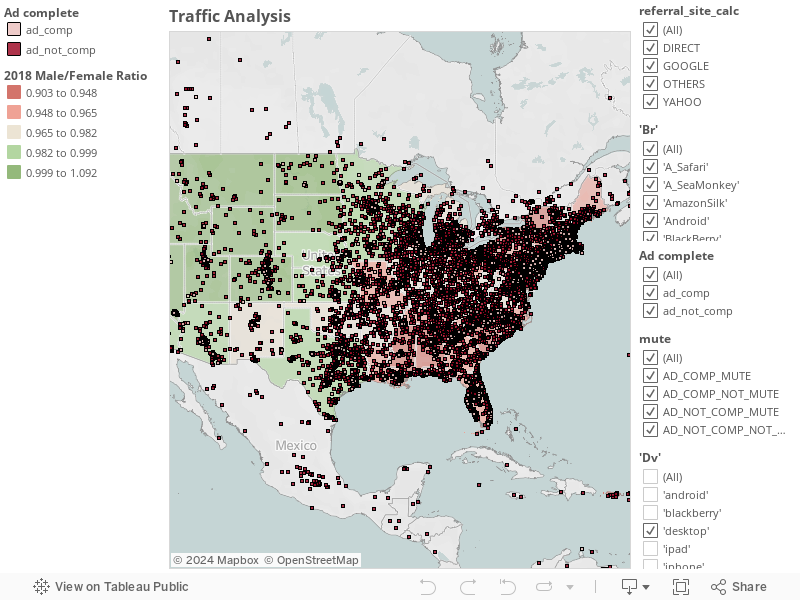
0 Comments
Leave a Reply. |
